Event monitoring tools are software solutions designed to track, analyze, and manage events across various systems, applications, or environments.
These tools are widely used in IT operations, security monitoring, application performance management, and even live event tracking. They help organizations gain real-time visibility into their systems, enabling proactive issue resolution and improved decision-making.
What Are Event Monitoring Tools?
Event monitoring tools collect data from various sources, such as system logs, application metrics, user interactions, or network activity. They process this data to identify patterns, anomalies, or critical events that require attention.
These tools often provide alerts and visual dashboards to help users quickly understand and respond to issues.
Key Features
- Real-Time Monitoring: Continuous tracking of events as they occur.
- Alerts and Notifications: Immediate alerts for critical events or anomalies.
- Data Visualization: Dashboards and reports for easy interpretation of data.
- Integration: Compatibility with other systems or tools for seamless workflows.
- Scalability: Ability to handle large volumes of data across complex environments.
Benefits of Event Monitoring Tools
- Proactive Problem Resolution: Early detection of issues helps prevent system failures or downtime.
- Enhanced Security: Monitoring tools can detect suspicious activities or unauthorized access in real time.
- Operational Efficiency: By automating event tracking and prioritizing critical alerts, these tools reduce manual effort and improve response times.
- Data-Driven Decision Making: Insights derived from event data enable organizations to optimize processes and improve performance.
Types of Event Monitoring Tools
1. IT Infrastructure Monitoring
- Tools in this category monitor servers, networks, databases, and other infrastructure components.
- Examples include solutions that track CPU usage, memory consumption, disk space, and network traffic.
2. Application Performance Monitoring (APM)
- These tools focus on the performance and availability of applications.
- They help identify bottlenecks in code execution or database queries.
3. Security Event Monitoring
- Security-focused tools monitor access logs, detect potential breaches, and ensure compliance with regulations.
- They are essential for safeguarding sensitive data.
4. User Behavior Tracking
- These tools monitor how users interact with applications or websites.
- Insights from user behavior can improve user experience and optimize workflows.
5. Live Event Management
- Used in large-scale events to ensure smooth operations by monitoring crowd behavior or logistics.
Applications of Event Monitoring Tools
- IT Operations: Ensuring uptime by monitoring servers, networks, and applications.
- Cybersecurity: Detecting threats like unauthorized access or malware attacks.
- Customer Experience: Analyzing user behavior to improve digital experiences.
- Compliance: Tracking activity logs to meet regulatory requirements.
- Event Management: Managing logistics and safety during live events.
Event monitoring tools are vital for maintaining system reliability, improving security posture, and optimizing operational efficiency. By leveraging these tools effectively, organizations can proactively address challenges while ensuring smooth operations across their environments.
10 Best Event Monitoring Tools
- Splunk: Comprehensive platform for real-time data analysis, event monitoring, and security incident detection.
- Nagios: Powerful tool for monitoring systems, networks, and infrastructure, offering alerting and reporting capabilities.
- SolarWinds: Robust event monitoring solution with extensive network and application performance management features.
- Datadog: Cloud-based monitoring tool that provides end-to-end visibility across infrastructure, applications, and logs.
- ManageEngine AD Audit Plus: Real-time Active Directory auditing and monitoring tool for security and compliance.
- Zabbix: Open-source monitoring solution for networks, servers, and applications featuring customizable alerts and dashboards.
- New Relic: Comprehensive observability platform for monitoring application performance and infrastructure in real time.
- Prometheus: Open-source monitoring tool designed for reliability and scalability, ideal for cloud-native environments.
- Dynatrace: An AI-driven monitoring platform that provides deep insights into application performance and user experiences.
- Graylog: Centralized log management tool that enables real-time log analysis and event monitoring.
| 10 Best event monitoring tools | Features | Stand-alone Feature | Pricing | Free Trial / Demo |
|---|---|---|---|---|
| 1. Splunk | Offers data displays in real-time. Costs and resources in the cloud are managed. Offers data displays in real-time. Makes sure that storage systems are running at their best. Checks the health of an application and the user experience. |
Advanced data analytics and real-time monitoring. | Custom, usage-based pricing | Yes |
| 2. Nagios | Sets performance benchmarks so that results can be compared. AI is used to find and figure out what went wrong automatically. Makes sure that the web and mobile experiences are the best they can be. Finds threats, weaknesses, and compliance problems. Makes data displays that can be changed to fit your needs. |
Comprehensive network and system performance monitoring. | Custom, based on needs | No |
| 3. SolarWinds | Offers data displays in real-time. Costs and resources in the cloud are managed. Offers data displays in real-time. Makes sure that storage systems are running at their best. Checks the health of an application and the user experience. |
Integrated network, server, and application monitoring. | Starts at $1,995 | Yes |
| 4. Datadog | Servers, virtualization, and cloud resources are all kept an eye on. Finds security vulnerabilities and threats. Changes and configurations of devices are managed. Costs and resources in the cloud are managed. Offers data displays in real-time. |
Unified monitoring and observability platform. | $15 per host/month | Yes |
| 5. ManageEngine AD Audit Plus | Real-time Active Directory auditing User activity monitoring and reporting Compliance-ready audit reports Customizable alerting and notifications Detailed logon and logoff tracking |
In-depth Active Directory change auditing. | Starts at $595 | Yes |
| 6. Zabbix | Supports both monitoring with agents and monitoring without agents. Plugins and custom scripts can be used. Tracks the health of the whole service. Makes custom reports for reporting and analysis Features for controlling user access and keeping data safe. |
Scalable monitoring for networks and applications. | Free, open-source | No |
| 7. New Relic | Makes data displays that can be changed to fit your needs. Sets performance benchmarks so that results can be compared. Collects and displays data about your own performance. Integrates with CI/CD pipelines so that monitoring can happen all the time. works in different environments and on different platforms. |
Full-stack observability with advanced analytics. | Free, paid options | Yes |
| 8. Prometheus | Affordable and flexible way to keep an eye on things. Data about time-series metrics is scraped and collected. Querying and filtering are more flexible. benefits from having a community of active users. Alerts are made based on conditions that have already been set. |
Open-source system monitoring and alerting toolkit. | Free, open-source | No |
| 9. Dynatrace | Data that is being watched is shown visually in real-time. Many plugins can add to it. Responses to predefined events are done automatically. Reports are made for analysis and to meet regulations. System uptime and downtime are kept track of. |
AI-powered performance monitoring and analytics. | Custom, based on needs | Yes |
| 10. Graylog | Data that is being watched is shown visually in real-time. Many plugins can be added to it. Responses to predefined events are done automatically. Reports are made for analysis and to meet regulations. System uptime and downtime are kept track of. |
Centralized log management and real-time analysis. | Free, paid options | Yes |
1. Splunk
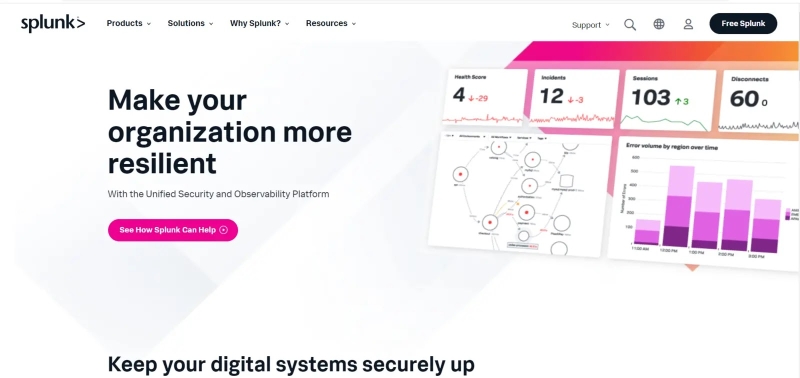
Splunk
Splunk is a powerful event-monitoring tool that collects, indexes, and analyzes machine-generated data in real time.
It enables organizations to gain insights from their data for IT operations, security, and business analytics.
With its robust search and visualization capabilities, Splunk helps monitor and troubleshoot applications, detect security threats, and ensure compliance, making it an essential tool for efficient event management and operational intelligence.
Why Do We Recommend It?
- Aids in maintaining and troubleshooting IT systems and applications.
- Provides information about the creation and performance of applications.
- User access and permissions are subject to granular management.
- Specifically created for the analysis of machine-generated data from different sources.
| What Could Be Better? | What Could Be Better ? |
|---|---|
| Offers advanced search and analysis tools for different kinds of data made by machines. | Licenses can limit the amount of data that can be collected, which can affect large environments. |
| It uses machine learning for predictive analytics and finding out-of-the-ordinary things. | What Could Be Better? |
| Offers tools for monitoring security, finding threats, and managing compliance. | It can take a lot of time to manage and maintain Splunk deployments. |
| Offers tools for keeping an eye on security, finding threats, and managing compliance. | On the market, new options have come up that offer similar features at a price that might be lower. |
2. Nagios
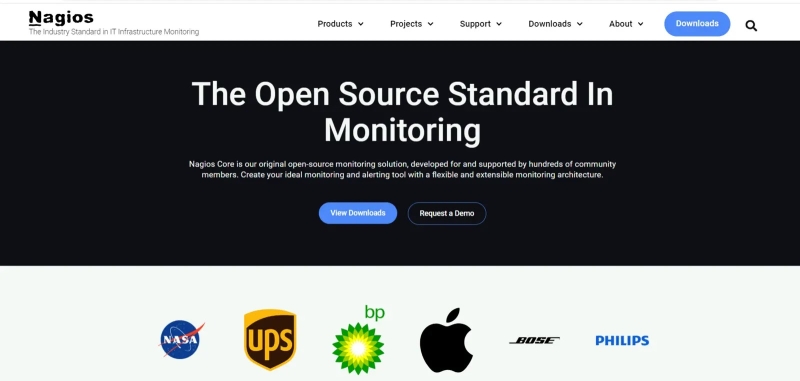
Nagios
Nagios is a powerful open-source event monitoring tool for monitoring network services, host resources, and network infrastructure.
It provides real-time alerting and reporting on system status and performance, enabling IT administrators to detect and resolve issues promptly.
Nagios supports various plugins, making it highly customizable to fit various monitoring needs, from basic server health checks to complex network monitoring setups.
Its robust notification system ensures that administrators are promptly informed of issues, facilitating quick responses to maintain system uptime and reliability.
Why Do We Recommend It?
- Monitors network hardware, including firewalls, switches, and routers.
- Gathers and keeps track of system-level metrics like disk, CPU, and memory use.
- Offers a user-friendly configuration and monitoring interface.
- Keeps a record of alerts and notifications for the purpose of auditing.
| What Could Be Better? | Offers alerting and notification options that can be changed based on conditions already set. |
|---|---|
| Offers a lot of ways to keep track of different IT components, services, and applications. | Nagios can send out too many alerts and make too much noise without careful setup. |
| Offers alerting and notification options that can be changed based on conditions that have already been set. | Without careful setup, Nagios can send out too many alerts and make too much noise. |
| Allows different devices and services to be monitored from a single interface. | May not have some of the more advanced features that more recent monitoring tools do. |
| Keeps track of past performance data and makes reports that can be used for analysis. | Nagios itself can use up resources, which could affect the systems it is watching. |
3. SolarWinds
SolarWinds
SolarWinds event monitoring tools provide comprehensive solutions for tracking and managing IT infrastructure events.
They offer real-time visibility into network performance, server health, and application behavior, helping to identify and resolve issues quickly.
SolarWinds tools feature advanced alerting, detailed reporting, and customizable dashboards, making them essential for maintaining operational efficiency and preventing downtime in complex IT environments.
Why Do We Recommend It?
- Checks the performance and security of wireless networks and devices.
- Makes dashboards and reports that can be changed to help visualize data.
- It keeps an eye on resources both on-premises and in the cloud.
- Analyzes the patterns of network traffic to learn more and fix problems.
- APIs make it possible to connect to third-party tools and services.
| What Could Be Better? | What Could Be Better ? |
|---|---|
| Offers a wide range of tools for monitoring infrastructure, systems, applications, and networks. | For people who are new to monitoring, some features and setups may be hard to understand. |
| Helps automate and fix workflows so that problems can be fixed quickly. | Because there are so many features, some of them might not be useful for every organization. |
| Gets resources, plugins, and integrations from a community of active users. | Some integrations and more advanced features may only be available in paid versions. |
| Monitors resources both on-site and in the cloud | It might take time and practice to learn and use all of the features. |
4. Datadog
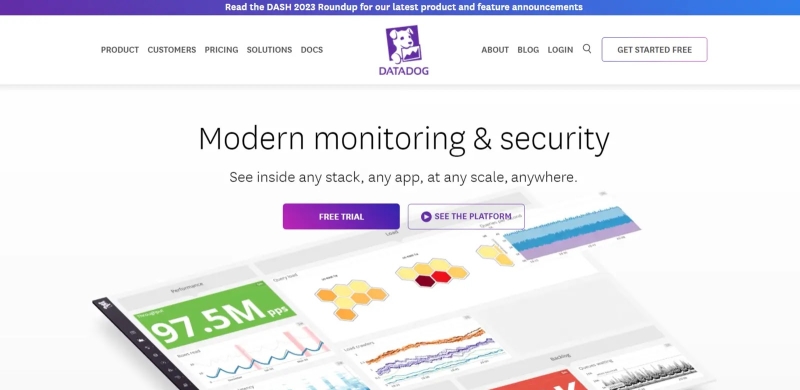
Datadog
Datadog is a powerful event-monitoring tool for IT infrastructure, applications, and logs.
It provides real-time observability through comprehensive dashboards, alerts, and analytics, allowing teams to monitor system performance, detect anomalies, and troubleshoot issues efficiently.
Datadog integrates seamlessly with various technologies, offering extensive support for cloud services, containers, and on-premise environments, making it an essential tool for maintaining the health and performance of modern IT ecosystems.
Why Do We Recommend It?
- Connects events and data to get a better understanding.
- Tags make it possible to keep track of and see custom metrics.
- Keeps an eye on how well mobile apps are doing.
- Helps teams work together and works with tools for working together.
| What Could Be Better? | What Could Be Better ? |
|---|---|
| Allows dashboards and data visualizations to be made in a variety of ways. | In some situations, you might be unable to change some more advanced settings. |
| Good for monitoring microservices, containers, and resources in the cloud. | Setting up and configuring the platform for the first time could be difficult. |
| Uses machine learning to find out about unusual things and do predictive analytics. | Offers alerting and notification options that can be changed so you can act quickly. |
| It uses machine learning to find out about unusual things and do predictive analytics. | Agents have to be set up for monitoring, which might not work in all situations. |
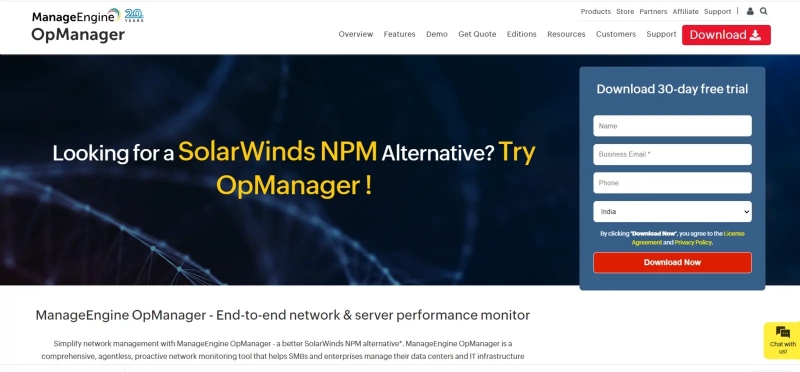
5. ManageEngine AD Audit Plus
ManageEngine AD Audit Plus is an advanced event monitoring tool designed to enhance security and compliance for Active Directory environments.
It provides real-time auditing, in-depth reporting, and alerting capabilities, allowing organizations to track changes, monitor user activities, and detect potential threats.
With its user-friendly interface and customizable reports, AD Audit Plus helps ensure compliance with regulatory standards and improves overall IT governance.
Why Do We Recommend It?
- Comprehensive real-time auditing for Active Directory environments
- In-depth reporting and customizable alerts for enhanced security
- User-friendly interface simplifies monitoring and management
- Helps ensure compliance with regulatory standards
- Improves overall IT governance and threat detection
| What is Good ? | What is Good? |
|---|---|
| Real-time auditing and alerting | Initial setup can be time-consuming |
| Comprehensive reporting and compliance tools | Limited customization for some reports |
| Easy integration with Active Directory | Higher cost compared to some alternatives |
| User activity monitoring and tracking | Performance impact on large environments |
6. Zabbix
Zabbix
Zabbix is an open-source event monitoring tool designed for real-time monitoring of servers, networks, and applications.
It provides comprehensive monitoring capabilities, including data collection, alerting, and visualization, enabling organizations to detect and respond to issues promptly.
Zabbix supports a wide range of protocols and offers flexible configuration options, making it suitable for various IT infrastructures.
Its scalability and robust features make it a popular choice for both small and large enterprises seeking effective infrastructure monitoring and performance management.
Why Do We Recommend It?
- Checks the availability and performance of network devices, servers, and services.
- IPMI and Java Management Extensions (JMX) can be used to monitor the hardware (JMX).
- Runs custom scripts to monitor devices or services that are not standard.
- Offers backup and failover options to make the system more available.
| What Could Be Better? | What Could Be Better ? |
|---|---|
| Agent-based monitoring and monitoring without agents are both supported. | To handle very large environments, you might need to configure and optimize them more. |
| Makes dashboards and visualizations that can be changed to show data. | For monitoring, new devices may need to be set up by hand. |
| It can automatically find and monitor network devices. | Without careful setup, Zabbix could send out too many alerts. |
| Identifies and fixes performance problems before they happen. | Advanced features and customization may take time and training for users to fully understand. |
7. New Relic
New Relic
New Relic is a comprehensive event monitoring tool that provides real-time insights into application performance and infrastructure health.
It offers detailed analytics and alerting features, helping organizations quickly identify and resolve issues.
With its powerful dashboards and customizable metrics, New Relic enables proactive monitoring, ensuring optimal system performance and reliability.
Why Do We Recommend It?
- uses machine learning to look at trends and make predictions.
- Allows teams to work together and share their ideas.
- It lets you keep track of and see custom metrics and events.
- Checks on the performance of serverless functions.
| What Could Be Better? | What Could Be Better ? |
|---|---|
| Simulates how a user would interact with an application to test its availability and performance. | Security concerns are raised when sensitive information is shared with a third-party service. |
| Keeps an eye on servers, containers, and cloud infrastructure health. | Agents have to be set up for monitoring, which might not work in all environments. |
| In some situations, you might be unable to change some more advanced settings. | For easy navigation, the user interface might need some changes. |
| Provides a single platform for keeping an eye on applications, infrastructure, and the user experience. | Provides a single platform for keeping an eye on applications, infrastructure, and user experience. |
8. Prometheus
Prometheus
Prometheus is an open-source event monitoring and alerting toolkit designed for reliability and scalability.
It collects and stores metrics as time series data, offering powerful querying and visualization capabilities.
With robust support for multi-dimensional data collection, Prometheus is widely used for monitoring dynamic cloud environments and microservices, providing real-time insights and automated alerts to ensure optimal system performance..
Why Do We Recommend It?
- Can work with long-term storage solutions from outside.
- Handles alerts and manages how they are sent and how they are turned off.
- Shows its own performance metrics, which lets it keep an eye on itself.
- Good for keeping an eye on containerized apps and microservices.
| What Could Be Better? | What Could Be Better ? |
|---|---|
| Collects metrics through regular scrapes, which keeps the load on monitored targets to a minimum. | There isn’t much built-in help for storing historical data for a long time. |
| Provides a powerful query language that can be used to find and change data. | The Prometheus server can use up system resources, which can slow down the system. |
| Finds and adds new targets to be monitored automatically. | Policies for keeping data can be kept and managed manually. |
| Supports alerting based on conditions that have already been set. | Setting up alerts can be hard and may require careful setup. |
9. Dynatrace
Dynatrace
Dynatrace is an advanced event-monitoring tool that provides comprehensive observability and automated monitoring across applications, infrastructure, and user experiences.
It leverages artificial intelligence to deliver real-time insights, detect anomalies, and provide root-cause analysis, helping organizations ensure optimal performance and reliability of their IT environments.
Dynatrace’s unified platform integrates seamlessly with various technologies, offering end-to-end visibility and facilitating proactive management of complex, modern cloud environments.
Why Do We Recommend It?
- Integrates with DevOps processes so that monitoring can happen all the time.
- Tracks how APIs are used and how well they work.
- Keeps an eye on IoT devices and how they affect applications.
- Keeps an eye on how well mobile apps are doing.
| What Could Be Better? | What Could Be Better ? |
|---|---|
| Offers a single way to observe applications, infrastructure, and the user experience. | Agents have to be set up for monitoring, which might not work in all situations. |
| Supports automated workflows that help find and fix problems. | Vendor lock-in could happen if you depend too much on Dynatrace tools. |
| focuses on how the end user feels and how it affects business. | Focuses on how the end user feels and how it affects business. |
| Finds and maps application components and their dependencies automatically. | Setting up and configuring the system for the first time could be hard for new users. |
10. Graylog

Graylog
Graylog is an open-source event monitoring tool designed for real-time log management and analysis. It provides centralized log collection, storage, and visualization, enabling IT teams to monitor and troubleshoot systems effectively.
With its powerful search and filter capabilities, Graylog helps in identifying and responding to security incidents, performance issues, and system anomalies quickly.
Its extensible architecture supports integration with various data sources and third-party tools, making it a versatile solution for comprehensive event monitoring and analysis.
Why Do We Recommend It?
- Fits for monitoring environments that use containers or the cloud.
- Log data from different sources is gathered and sent.
- Log processing can be scaled up and spread out.
- Offers an API that can be used to connect to other systems and automate tasks.
| What is Good ? | What is Good? |
|---|---|
| Since it’s open source, it’s cheap and can be changed to fit your needs. | It gives you basic options for visualizing data, but it might not have as many features as specialized tools. |
| Uses external sources and lookups to add context to log data. | There might be limits on how much you can change things. |
| Has a dedicated user community that makes resources and plugins possible. | What Could Be Better? |
| Offers ready-made configurations for taking in certain types of logs. | Maintenance and updates might need your attention on a regular basis. |


