The process of regularly observing and evaluating the functionality, accessibility, and overall health of computer servers within a network infrastructure is called server monitoring.
It requires regular observation of a host of server metrics and characteristics to identify problems and potential bottlenecks and ensure that the server is running optimally.
Monitoring a server typically involves monitoring variables such as CPU consumption, memory usage, disk space usage, network traffic, server response time, and application availability.
These measurements allow administrators to detect faults, prevent downtime, and improve server performance. Server monitoring software can automate the process, collect data, generate alerts or notifications, and provide administrators with analytical information and reports so they can make informed decisions and take action.
How Server Monitoring Works?
Server monitoring uses a variety of methods and techniques to collect data and continually assess performance. Monitoring important data, checking logs, and raising alerts or notifications when anomalies or problems are detected are all part of the process.
Server monitoring tools are initially installed on the server or network device being monitored. These tools typically use either an agent-based or agentless approach. Agent-based monitoring uses a small software agent on each server to collect data and send it to a central server.
In contrast, agentless monitoring accesses server metrics remotely via SNMP or WMI. Once configured, monitoring tools collect data about CPU, RAM, disk space, network traffic, and other server characteristics.
What Is A Server Monitoring Tool?
Server monitoring tools monitor the functionality, availability, and health of computer servers. These systems allow administrators to monitor multiple servers, collect data, analyze metrics, and send alerts or notifications when problems arise.
Server performance monitoring tools come with a variety of features and capabilities. They can monitor CPU and memory consumption data, storage space, network traffic, server response time, application availability, and other metrics.
Agent-based and agentless monitoring solutions collect data from servers and network devices. Data is processed and reviewed in real-time or at predefined intervals and compared to baselines or thresholds.
Monitoring tools send alerts or warnings to administrators when measurements fall outside pre-defined limits or deviate from expected patterns.
How Do We Pick The Best Server Monitoring Tools?
Choosing the best server monitoring tool requires careful consideration of various factors to ensure it meets your specific requirements and fits the needs of your organization. Here are some key considerations to help you choose the best server monitoring tool:
- Define your monitoring goals: The first step should clearly state your priorities and objectives. Identify the most critical metrics and parameters you wish to track, the level of detail required, and any unique compliance or regulatory requirements that must be met.
- Scalability and flexibility: Check the monitoring tool’s ability to scale. Check its ability to manage your current server infrastructure and allow for growth.
- Ease of use and UI: The general usability and UI of the analytics tool. It must have a user-friendly layout, simple navigation, and a neatly arranged dashboard.
- Alerting and notification capabilities: Check the tool’s alerting and notification capabilities. You should be able to set thresholds, configure alerts, and choose the type of notification you prefer (email, SMS, etc.).
- Data Collection and Analysis: The ability of the analytics tool to collect data. It should be able to collect, examine, and provide real-time or near-real-time insights from a variety of server metrics.
- Integration and compatibility: Consider the tool’s ability to integrate with other IT management systems and third-party applications.
- Support and documentation: Consider the vendor’s level of technical support and documentation. Make sure they offer thorough manuals, knowledge bases, training materials, and discussion forums.
- Cost and licensing: Analyze the licensing and pricing policy of the tool. Check if it fits your budget and offers basic functionality within your spending limit.
Here Are Our Picks For The Best Server Monitoring Tools And Their Feature
- Nagios: Comprehensive monitoring and alerting for servers, switches, applications, and services.
- Zabbix: Provides real-time monitoring, alerting, and visualization for network devices, servers, and applications.
- Prometheus: Open source systems monitoring with a powerful query language and built-in alerting.
- SolarWinds Server and Application Monitor: Track the performance and availability of servers and applications.
- Datadog: Cloud-based monitoring with real-time visibility into infrastructure, applications, and logs.
- PRTG Network Monitor: Monitor network performance, devices, bandwidth, and server health.
- New Relic: Provides detailed performance monitoring and diagnostics for applications and infrastructure.
- Dynatrace: AI-powered monitoring for applications, infrastructure, and user experience.
- ManageEngine: Unified monitoring for servers, networks, applications, and cloud services.
- Cacti: An all-in-one network monitoring solution for bandwidth, uptime, and performance.
| 10 Server Monitoring Tools | feature | Independent functions | price | Free Trial/Demo |
|---|---|---|---|---|
| 1. Nagios | 1. Monitoring 2. Alerts 3. Event Management 4. Performance Visualization |
A wide range of plugins supports various monitoring needs. | $1,995 to $5,995 | No |
| 2. Zabbix | 1. Internet tracking 2. Monitoring using SNMP 3. Application tracking 4. Customizable dashboard |
Unified monitoring of networks, servers, and applications. | Open source, free | Yes |
| 3. Prometheus | 1. Time Series Data Collection 2. Capture and store metrics 3. Metrics capture and storage 4. Alert and notification system |
Time series data collection with powerful query capabilities. | Open source, free | No |
| 4. SolarWinds Server and Application Monitor | 1. Application Performance Monitoring (APM) 2. Infrastructure Monitoring 3. Real-time analysis and reporting 4. EUM stands for End User Monitoring. |
Comprehensive application performance management. | Starting at $2,995 | Yes |
| 5. Datadog | 1. Infrastructure monitoring 2. Application Performance Monitoring (APM) 3. Log Management 4. Real User Monitoring (RUM) 5. Network performance monitoring |
Real-time monitoring with advanced analytics. | $15 per host per month | Yes |
| 6. PRTG Network Monitor | 1. Server and application monitoring 2. Real-time performance monitoring 3. Real-time performance monitoring 4. Reports and Dashboards |
Versatile, customizable sensors for all your devices. | Starting at $1,750 | Yes |
| 7. New Relic | 1. Application Performance Monitoring (APM) 2. Infrastructure Monitoring 3. Real-time analysis and reporting 4. EUM stands for End User Monitoring. |
Full-stack observability for applications and infrastructure. | Starting at $99 per month | Yes |
| 8. Dynatrace | 1. Real-time user monitoring 2. User experience tracking 3. Browser Tracking 4. Performance indicator tracking |
Automated root cause analysis driven by artificial intelligence. | Starting from $69 per month | Yes |
| 9. ManageEngine | 1. Endpoint Management 2. Patch Management 3. Mobile device management 4. Remote access and control |
Integrated monitoring and IT management solutions. | 10 servers $945 | Yes |
| 10. Cactus | 1. Custom sensor design 2. Virtualization tracking 3. Database monitoring 4. Connection with other systems and tools |
All-in-one monitoring with an intuitive interface. | Starting at $1,750 | Yes |
1. Nagios
Nagios
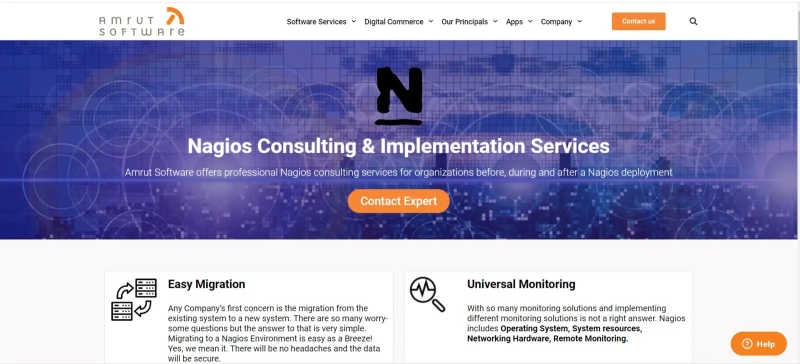
Nagios is an open source server monitoring tool that can comprehensively monitor network services, host resources, and network infrastructure to ensure high availability and performance of critical IT systems.
It provides real-time monitoring, alerting, and reporting capabilities, enabling administrators to quickly detect and resolve issues, minimize downtime and ensure business continuity.
Nagios is highly customizable and extensible, supporting a wide range of plugins and integrations. This makes it suitable for diverse environments and complex monitoring requirements.
Why do we recommend it?
- Nagios can monitor a variety of resources, including servers, network devices, applications, services, and environmental factors.
- Nagios is a versatile configuration framework that allows you to design custom monitoring checks and thresholds according to your needs.
- It provides powerful alerting and notification capabilities to inform system administrators of outages and possible problems.
- Nagios provides a web-based interface for viewing the status of monitored services, acknowledging alerts, scheduling downtime, and performing administrative duties.
Pros and Cons
| advantage | shortcoming |
|---|---|
| 1. Proven and established | 1. Configuration complexity |
| 2. Customizable and Scalable: | 2. User Interface |
| 3. Flexibility | 3. User Interface |
| 4. Alerts and Notifications | 4. Lack of advanced features |
2. Zabbix
Zabbix
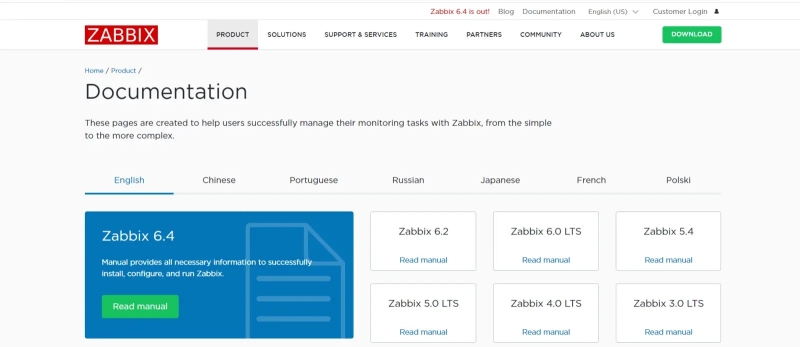
Zabbix is an open source server monitoring tool that provides comprehensive monitoring and analysis for various network services, servers, and hardware, ensuring proactive detection and resolution of problems.
It provides powerful features such as real-time monitoring, alerting, and visualization, enabling administrators to maintain high availability and performance of their IT infrastructure through detailed metrics and trends.
Zabbix supports multiple platforms and is highly customizable. It allows integration with numerous third-party solutions and has the ability to scale from small environments to large enterprise networks.
Why do we recommend it?
- Zabbix can monitor a variety of resources such as servers, virtual machines, network devices, applications, and services.
- It includes an auto-discovery feature that automatically finds and adds new devices or services to the monitoring environment.
- Zabbix has a web-based interface that includes customized dashboards and visualization capabilities.
- You can configure customizable alert and notification rules in Zabbix based on predefined thresholds or custom triggers.
Pros and Cons
| advantage | shortcoming |
|---|---|
| 1. Proven and established | 1. Configuration complexity: |
| 2. Customizable and Scalable: | 2. User Interface: |
| 3. Flexibility | 3. Scalability Challenges: |
| 4. Alerts and Notifications: | 4. Lack of advanced features |
3. Prometheus
Prometheus
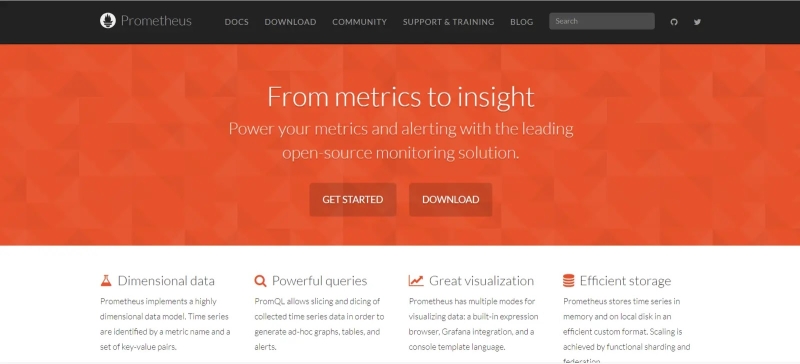
Prometheus is a free and open source monitoring and alerting toolkit for collecting and analyzing time series data. It uses a pull-based architecture to periodically retrieve metric data from a target via HTTP or other supported protocols.
The Prometheus server is the core of the system, responsible for collecting, storing, and analyzing indicator data. Users can use Prometheus’s powerful query language PromQL to obtain and change indicator data for analysis and visualization.
Prometheus also provides alerts based on specified rules. Prometheus provides a reliable and adaptable monitoring solution for contemporary distributed systems and microservice architectures.
Why do we recommend it?
- Prometheus captures time series data from the targets it is monitoring.
- It uses a multidimensional data model that allows users to tag time series data using key-value pairs (tags).
- Prometheus Query Language (PromQL) is a flexible language for querying and manipulating time series data.
Pros and Cons
| advantage | shortcoming |
|---|---|
| 1. Powerful monitoring and alarm functions | 1. Storage Limitations |
| 2. Scalability | 2. Complexity of large-scale setup |
| 3. Flexibility and scalability | 3. Lack of native high availability: |
| 4. Pull-based model | 4. Resource requirements: |
4. SolarWinds Server & Application Monitor
SolarWinds Server and Application Monitor (SAM) is an all-in-one monitoring solution for complex IT systems, providing deep insight into the performance and availability of servers, applications, and infrastructure.
Its agentless architecture uses industry-standard protocols, including SNMP, WMI, and PowerShell, to collect data from servers and applications. SAM provides real-time monitoring, displaying performance metrics and status in intuitive dashboards, graphs, and charts.
It also enables capacity planning by analyzing historical data trends and providing predictive insights. SAM supports automation and remediation by integrating with other SolarWinds tools, allowing administrators to execute scripts or perform actions to resolve issues remotely.
Why do we recommend it?
- SAM provides comprehensive monitoring capabilities for real and virtual servers, allowing you to track key performance parameters such as CPU consumption, memory utilization, disk I/O, and network traffic.
- It detects and maps the dependencies between applications and the underlying infrastructure components they depend on.
- It allows you to configure thresholds and alerts based on established or custom performance metrics.
- SAM includes a large number of prepackaged application templates for common programs, databases, and Web servers.
Pros and Cons
| advantage | shortcoming |
|---|---|
| 1. Comprehensive monitoring | 1. Cost |
| 2. Ease of use | 2. Complexity of advanced configuration |
| 3. Scalability | 3. Resource requirements |
| 4. Alerts and Notifications | 4. Limited customization |
5. Datadog

Datadog is a powerful server monitoring tool designed to provide comprehensive visibility into the performance and health of your servers and applications.
It works by deploying agents on servers, collecting various metrics, storing and processing the data in a distributed backend infrastructure, and providing a centralized web interface to visualize and analyze metrics, set alerts, and take advantage of advanced monitoring capabilities.
With an intuitive interface and extensive visualization options, Datadog enables users to create customizable dashboards, set up automatic alerts, and collaborate effectively across teams to increase visibility and operational efficiency across the IT environment.
Why do we recommend it?
- Datadog monitors the health and performance of your infrastructure, including servers, VMs, containers, and cloud services.
- Datadog’s APM features help you monitor and analyze your application’s performance.
- Datadog can collect, aggregate, and analyze logs from a variety of sources.
- Datadog uses RUM to capture and analyze user interactions with your applications, helping you better understand the user experience.
Pros and Cons
| advantage | shortcoming |
|---|---|
| 1. Comprehensive monitoring | 1. Cost |
| 2. Real-time visibility | 2. Learning Curve |
| 3. AIOps and Machine Learning: | 3. Limited log management capabilities |
| 4. Customizable dashboards and visualizations | 4. Resource consumption |
6. PRTG Network Monitor

PRTG Network Monitor is an all-in-one network monitoring solution that gives you insight and control over your network infrastructure, devices, and applications.
It collects real-time performance data and metrics using monitoring technologies such as SNMP, WMI, NetFlow, and packet sniffing.
It provides a variety of predefined sensors for monitoring various characteristics of network devices and applications, such as bandwidth usage, CPU and memory utilization, reaction time, and service availability.
PRTG’s scalability enables administrators to monitor small to large networks and provides remote monitoring, allowing them to monitor decentralized setups.
Why do we recommend it?
- PRTG can monitor many network devices, including routers, switches, firewalls, servers, and more.
- PRTG includes a bandwidth monitoring feature that allows you to monitor and analyze network traffic.
- It allows you to build visual maps of your network infrastructure, showing the interactions and dependencies of network devices.
- PRTG allows you to configure custom performance indicator thresholds and triggers.
Pros and Cons
| advantage | shortcoming |
|---|---|
| 1. Ease of use | 1. Cost |
| 2. Scalability | 2. High learning difficulty |
| 3. Comprehensive monitoring capabilities | 3. Resource-intensive |
| 4. Customization and Flexibility: | 4. Customization restrictions |
7. New Relic
New Relic
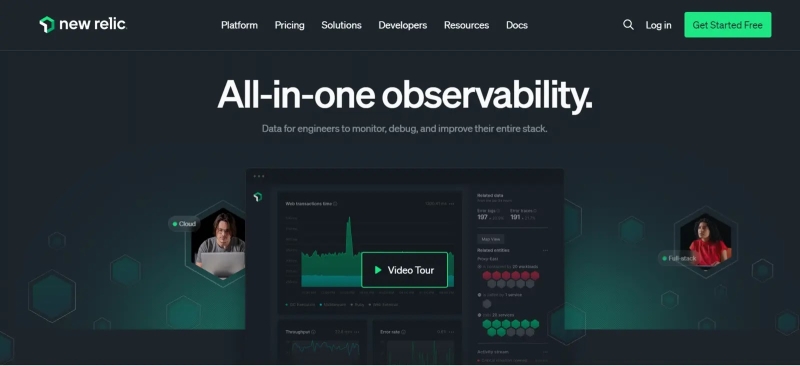
New Relic Server Monitoring is a real-time tool designed to monitor server performance and health. It uses a lightweight agent on each server to collect metrics such as CPU usage, memory utilization, disk I/O, network traffic, and process activity.
It also provides alerting capabilities, historical data storage and analysis, trend analysis, capacity planning, and troubleshooting of server-related issues.
It simplifies the monitoring and management of server infrastructure, ensuring optimal performance and minimizing downtime.
Why do we recommend it?
- New Relic’s APM capabilities are extensive, allowing you to monitor your application’s performance in real time.
- With New Relic, you can monitor the health and performance of servers, virtual machines, containers, and other infrastructure components.
- We can leverage this capability to replicate user interactions with your application from different geographic regions.
- You can use New Relic’s mobile monitoring capabilities to track the performance of your mobile applications across multiple platforms and devices.
Pros and Cons
| advantage | shortcoming |
|---|---|
| 1. Comprehensive monitoring | 1. Cost |
| 2. Application-centric | 2. Complexity for beginners |
| 3. Easy to use | 3. Limited Data Retention |
| 4. Integration and Ecosystem | 4. Integration Challenges |
8. Dynatrace
Dynatrace
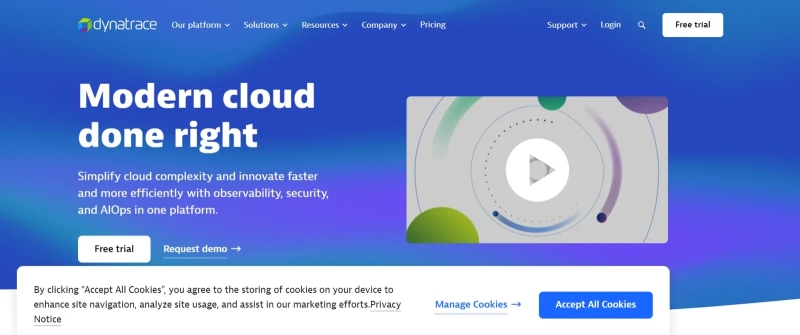
Dynatrace provides full-stack monitoring, automatically discovering and mapping all dependencies, ensuring comprehensive visibility across complex cloud environments, and delivering real-time insights to proactively resolve issues.
The platform uses AI-driven analytics to detect anomalies, identify root causes, and provide actionable insights, helping IT teams quickly resolve performance issues and maintain optimal application performance.
Dynatrace integrates seamlessly with multiple technologies and platforms, provides flexible deployment options, and supports continuous delivery pipelines to improve the efficiency and reliability of software development and operations.
Why do we recommend it?
- Dynatrace provides comprehensive insight into your technology stack, including applications, microservices, containers, cloud infrastructure, and more.
- Dynatrace’s APM capabilities enable you to monitor the performance of your applications across multiple programming languages and frameworks.
- It provides infrastructure monitoring for servers, virtual machines, cloud platforms, and containers.
- Dynatrace records and analyzes user interactions with your applications, giving you deep insight into the real user experience.
Pros and Cons
| advantage | shortcoming |
|---|---|
| 1. Deep application visibility | 1. Cost |
| 2. Automatic discovery and dependency mapping | 2. Learning Curve |
| 3. AI-driven root cause analysis | 3. Configuration complexity |
| 4. Scalability and cloud-native support | 4. Dependency on Agent Deployment |
9. ManageEngine

Management Engine
ManageEngine Server Monitoring Tool is a comprehensive solution for monitoring server performance and availability in your IT infrastructure.
It works by deploying agents on your servers to collect real-time data and metrics related to CPU usage, memory utilization, disk performance, network traffic, etc. The tool simplifies setup by providing preconfigured monitoring templates for various server platforms and applications.
ManageEngine server monitoring solutions feature a user-friendly interface and extensive functionality to simplify server management, improve performance, and ensure the availability of critical server infrastructure.
Why do we recommend it?
- ManageEngine provides network monitoring solutions that enable you to monitor the health and performance of your network infrastructure.
- ManageEngine’s ITSM solutions help enterprises simplify and automate their IT service delivery operations.
- It allows you to monitor the performance of servers and applications in your IT environment.
- ManageEngine provides help desk and ticketing tools to assist IT companies in managing and resolving support requests.
Pros and Cons
| advantage | shortcoming |
|---|---|
| 1. Comprehensive tool suite | 1. Complexity of advanced configuration |
| 2. User-friendly interface: | 2. Limited customization options |
| 3. Integration capabilities | 3. Support limitations |
| 4. Scalability |
10. Cacti
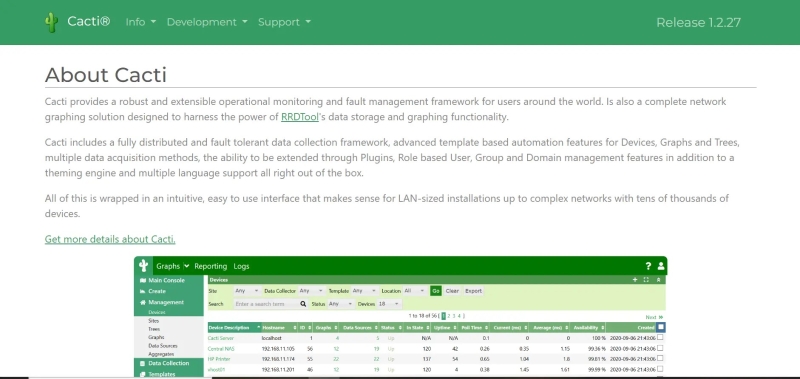
Cacti is an open source network monitoring and graphing tool designed to visualize time series data from network devices. It provides a powerful and user-friendly interface to track performance metrics.
It leverages the data storage and graphing capabilities of RRDTool, allowing users to create custom data sources and charts for detailed performance monitoring and trend analysis.
Cacti supports a range of templates and plugins, making it highly customizable and extensible to meet a wide range of network monitoring needs, from small home networks to large enterprise environments.
Why do we recommend it?
- Cacti provides comprehensive network graphing capabilities that allow detailed visualization of network performance metrics and historical data analysis, making it easier to identify trends and anomalies.
- It supports a wide range of data sources and devices, making it highly flexible to monitor different network environments and ensuring coverage of all critical systems.
- The tool is open source and highly customizable, enabling users to tailor it to specific monitoring needs without incurring additional costs, thereby increasing flexibility and cost-effectiveness.
Pros and Cons
| advantage | shortcoming |
|---|---|
| 1. Open source and low cost. | 1. Can be complicated to configure. |
| 2. Highly customizable through a variety of plugins. | 2. Real-time alert functionality is limited. |
| 3. Comprehensive graphics and visualization capabilities. | 3. The larger the dataset, the worse the performance. |


